DHCC Case Studies #
The first two case studies in what we hope will be a growing library.
Case Study 1: Hampshire Cultural Trust and Greenly #
Josephine Lethbridge and Jo Lindsay Walton, November 2023
Highlights
GLAM sector organisations face many challenges in decarbonisation, including need for financial support to decarbonise, and expertise in carbon accounting and management planning. Carbon accounting and management support needs to be offered accessibly and at scale, and there is a role for automated approaches to help this happen. Interdisciplinary academic expertise, including fields like the digital humanities, AI ethics, critical data studies, and political ecology, can usefully inform the further development of carbon accounting platforms and tools.
Hampshire Cultural Trust (HCT) is an independent charity that manages and supports visitor attractions, museums, art galleries and arts centres across the UK county of Hampshire. The trust runs a wide variety of workshops, classes, events and exhibitions, welcomes over 15,000 children every year to its immersive education programme, and runs projects with individuals, groups and communities that would otherwise not have access to culture. In addition, the trust cares for 2.5 million objects relating to Hampshire’s rich history. It employs around 140 staff and has over 400 volunteers. HCT has made a concerted effort to better understand and improve its environmental impact since 2019. Rolling, detailed action plans for the next 12 months have been developed, and a dedicated project team has been set up – 12-14 people from across the organisation, all of whom dedicate half a day per week to HCT’s environmental action. With the support of a small HEIF grant via the University of Sussex, we — Josephine Lethbridge and Jo Lindsay Walton, with support from other DHCC members — were able to engage with HCT in 2023 to find out about their approach to decarbonisation and to offer support. This support included bringing in the carbon accounting platform Greenly (see below) as a project partner.
Prior to this project, HCT had carried out a biodiversity opportunity review and buildings-level analysis for scope 1 and 2 emissions. (Scope 1 refers to direct emissions, e.g. vehicles, burning fuel on site, and scope 2 refers mostly to indirect emissions from buying electricity and heating/cooling). Based on this analysis and in partnership with the local council, HCT had also installed a total of 654 photovoltaic solar panels across four of its sites. In June 2022, HCT was given bronze accreditation from the Carbon Literacy Project and became the first museum organisation in the UK’s south to achieve Carbon Literate Organisation status.
When our project began, the trust’s main ambitions were to:
- Further develop action plans so as to achieve its commitment to reach net zero by 2030 (scopes 1 & 2) as well as reducing scope 3;
- Engage internal and external stakeholders around the severity of the climate crisis and the need for action.
HCT’s immediate ambitions, and reasons for getting involved in this project, were to carry out deeper analysis of its carbon impact, and include those learnings in the next version of its environmental action plan. As a charity, HCT does not have funds readily available to enact the costlier elements of this plan. Over the next year, the organisation has ambitions to raise £100,000 in funding to dedicate to its sustainability trajectory.
HCT’s key challenges, we heard at the outset of the process, included:
1. Accessing expertise
- Comprehensively calculating carbon emissions, and devising a plan for reducing them, are complex tasks requiring specialist skills and knowledge.
2. Prioritising and coordinating action
Of course, many decarbonisation actions can be taken even without comprehensive emissions data. However, without such data it is difficult to:
- know what to prioritise,
- ensure that teams across the organisation understand and feel invested in sustainability,
- persuade senior management to commit finance and other resources, and
- ensure a coordinated, evidence-based approach to new sustainability initiatives or projects.
3. Mobilising staff time and other resources to deliver
With staff often juggling many duties, it has sometimes been hard to get buy-in on sustainability initiatives. Staff may feel that sustainability is not really part of their job description. In the case of the HCT-Greenly engagement, however, there was dedicated staff time to compile and prepare the data for Greenly’s analysis.
Greenly #
To make timely progress toward net zero, all sectors need to decarbonise. But organisations come in many sizes and shapes. Some may have in-house expertise to do their own carbon accounting, or have resources to invest in climate consultants — but a great many don’t. Greenly is one of many fast-growing tech companies that position themselves as a tech solution to the time-consuming and complex tasks of carbon accounting and the creation of carbon management plans. There is some overlap between what Greenly does and climate consulting, except that ‘climate consulting’ tends to refer to more expensive, bespoke engagements, whereas Greenly wants to offer a relatively more accessible package. Companies operating in a similar space might include Watershed, Sweep, Plan A, Persefoni and Normative.
Founded in France in 2019, Greenly has more recently expanded into the US and UK. At the time of writing, Greenly has c. 170 staff and over 1500 clients. The bulk are small and medium-sized enterprises (SMEs), though they are increasingly working with bigger clients. Greenly offers its clients annual greenhouse gas (GHG) reports, support from its climate experts (i.e. carbon accounting and management experts), and automated carbon reduction suggestions through its platform.
Greenly calculate carbon footprints using a hybrid approach of spend-based and activity-based assessment. Spend-based assessment is relatively quick and easy to do. The amount a company spends across various categories is multiplied by numbers (Emissions Factors) representing typical GHG emissions associated with that type of spend, to get a rough idea of emissions. Activity-based assessment is much more detailed, and can require very complex data collection and analysis, but can be much more accurate. Greenly emphasise that carbon accounting should support actions to decarbonise, not become an end in itself. The flexible mix of spend- and activity-based assessment is a way of doing this while also keeping costs down.
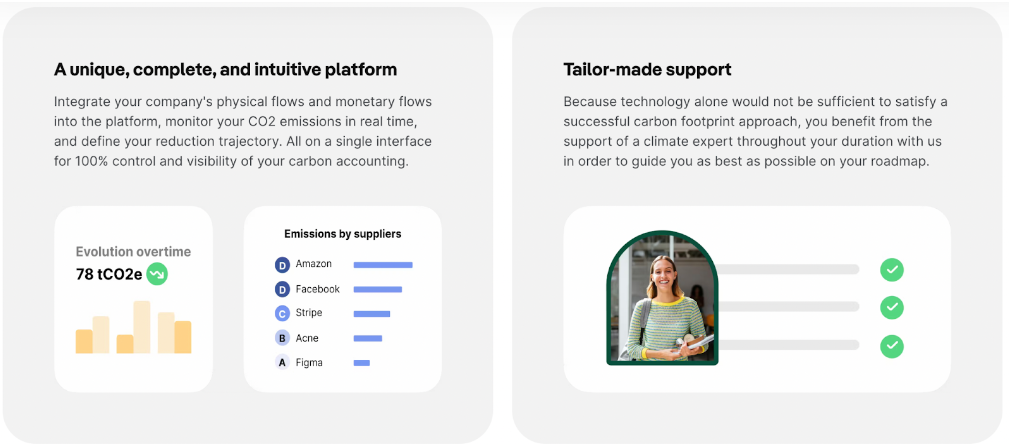
As well as the core carbon accounting offering, clients can also use the Greenly platform to engage employees and suppliers in the company’s climate journey, purchase carbon offsets, and/or work towards receiving the Greenly Net Zero Contributor certification (achieving this is reliant on paying Greenly to co-develop or audit these plans). They can also access some resources, such as slide decks, to help with communicating around decarbonisation and net zero.
Additional support from Greenly’s climate experts, for example providing deep-dive analysis into a particular portion of an organisation’s emissions, or in putting together a decarbonisation strategy, is also available for purchase. Further services are available through the Climate App Store section of the Greenly platform. This offers a wide range of tailored carbon calculators, from basic calculators which are free to use, to sector-specific paid-for ‘premium’ apps such as the cloud app, which integrates with cloud service provider APIs to measure carbon emissions based on hourly electricity map data. Similar premium apps are also available for websites, events, freight, menus and construction site carbon calculators, amongst others.
HCT was a slightly atypical client for Greenly, and part of the appeal of the project for Greenly was the chance to try out its tools and expertise in a new context. At the same time, expanding to serve new types of clients is very much part of Greenly’s model. Greenly aims to eventually create a platform that is near 100% automated, by learning from each client and building those learnings into the platform, so that next time a similar client comes along, they don’t need nearly as much face-to-face help.
Outcomes #
The HCT team was thrilled at the level of granularity available in the emissions data, and the variety of charts and views available. One team member told us: “We’re all a bit rabbit in the headlights at how brilliant it all is … It probably would have taken us a few years to get to this place.”
Overall, the spread of emissions over different aspects of HCT’s operations, and what this implied about main areas to focus on, tallied with HCT’s expectations, apart from some surprise at the scale of emissions deriving from service and product purchase.
The main benefit of the analysis was seen to be its potential in lending clarity and gravitas to the team’s existing plans. One told us: “We were really stuck. Some people want to see data and figures and proof backing up suggested approaches and action plans. So Greenly has really helped with that.” Another said: “Just having the data is fantastic. There’s going to be so many ways we can use it – in funding applications, fighting our case and trying to push things through with the council, and internally as well, being able to get people on board”.
We asked how the engagement could be further improved. HCT suggested they would be keen on more advice and support on using the data internally. This might also have included more active encouragement from the Greenly side for senior staff to engage, particularly for the final presentation, and to involve more staff from across the organisation in data collection.
Greenly were transparent about various assumptions, estimates and compromises which needed to be made along the way. “We were able to observe how such decisions, while made for good pragmatic reasons, tended to grow less visible over time. While this didn’t especially worry the HCT team, we wonder whether just a hint more acknowledgement of the estimated nature of the assessment could go a long way in terms of developing clients’ understanding of the nature of their emissions, and inform more robust measurement and action in the future.” For more on the relationship of uncertainty data and climate decision-making, see Communicating Climate Risk: A Toolkit.
As HCT mentioned internal comms as a topic of special interest, we also invited Climate Action Unit (CAU) to share their perspectives. We were joined by Freya Roberts for a wide-ranging discussion. One key principle which emerged was the importance of two-way dialogue: that individuals should get the space and support to express whatever challenges they face in taking action.
Future directions #
At time of writing, we are working on refining our recommendations for project partners. We hope to continue to work with both HCT and Greenly, and have recently sought follow-on funding (AHRC IAA and AHRC Net Zero Design Accelerator) to support this work. On the Greenly side, we see potential for expanding resources to support clients in using data internally and externally, opportunities around quantifying and visualising uncertainty, as well as localising decarbonisation recommendation resources, and transforming approaches to carbon offsetting. On the HCT side, we are exploring the possibility of delivering workshops for internal and/or external audiences to expand the opportunities for dialogue on decarbonisation.
If the ambition to automate carbon accounting is realistic – if Greenly are going to be able to make the process seamless and intelligible for their clients, and create GHG assessments that are accurate enough for those clients to develop comprehensive, tailored action plans – then the potential benefits could indeed be enormous. One presumes that costs might be so reduced that the carbon accounting platform would become accessible to organisations in the cultural sector that have traditionally struggled to raise any funds for this kind of work.
There are also potential policy implications. One expert we interviewed as part of our background research, who is a Managing Director of a Sustainability Consultancy in Southeast Asia, commented, “If platform services reduce the cost of decarbonisation for SMEs, then I can see that being a huge piece of the puzzle that’s missing. It would actually help the regulators roll out wider requirements on disclosure and perhaps even reduction. They’re very reluctant to do that right now due to high costs and perceived difficulty”.
The tech platform approach to carbon management is relatively new, and approaches are evolving rapidly. It is crucial that its evolution is shaped by all stakeholders, including interdisciplinary academic expertise. The use of automation indicates a clear role for disciplines and fields such as the digital humanities, critical data studies, AI ethics, and political ecology, as well as many different climate-related fields within the social and physical sciences.
Given that the main beneficiaries of the platform-based approach to carbon management include SMEs, NGOs or cultural organisations that those that don’t have the finances available for more expensive, sector-specific consultants, it’s crucial to consider how such platforms can better serve the specific needs of those organisations in the context of the overall aim of a just transition. The design of automated systems is seldom value-neutral, and we see collaborative, interdisciplinary approaches as the best way to ensure reflection and conversation around these issues.
It is also key to keep an open mind about the future. From what we have observed here, it is still difficult to say exactly how existing carbon accounting approaches would fit into the bigger social and economic shifts implied by most moderately positive vision of the future. Bold policy changes, and/or social, cultural and economic shifts, may transform the assumptions on which such engagements have operated to date.
### Digital Carbon ### The activity-based analysis that Greenly conducted around emissions related to HCT’s IT emissions were limited to the 2022 purchase of items in its IT inventory. As only a very small proportion of HCT’s emissions are related to IT usage, this was deemed to be more than enough detail. Greenly also offers (for an extra price) the use of its Green IT module. This enables companies to more accurately assess the emissions of their IT by collating an inventory of tech/terminals, measuring emissions related to data storage, adverts and web content. Purchase of this module is recommended for any company with a large proportion of IT-related emissions (at least <5%). How Greenly calculates cloud-related emissions for such clients may be of particular interest to readers of this case study. The major cloud providers are Amazon (AWS), Microsoft (Azure), and Alphabet/Google (GCP). The methodologies used by these companies to provide emissions data has been widely criticised. The three cloud giants’ overall role within climate transition is complicated, and impressive-looking climate strategies turn out to be very heavily based on offsetting and somewhat risky bets on future technological innovation. See e.g. Corporate Climate Responsibility Monitor for more details. 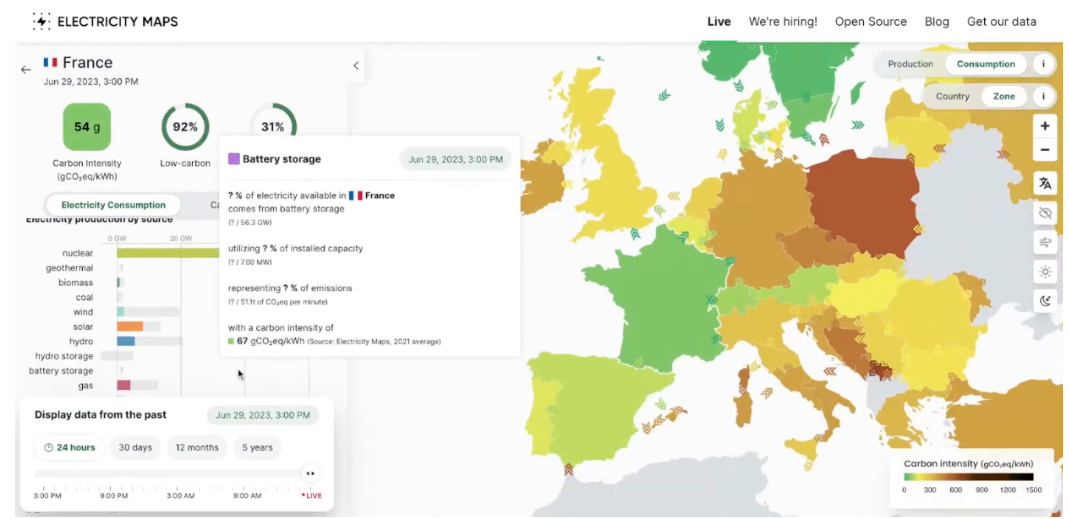 For cloud users who would prefer to get their emissions data from a different source, Greenly offers a more accurate estimation of the emissions tied to the actual energy their cloud providers have purchased through the grid. The module integrates information about the amount of data a company stores and processes, which cloud providers they use, the type of processors those providers use, the energy efficiency of those processors, the locations of the data centres, and so on. Time-sensitive data around energy usage, cloud provider and server location on the one hand is paired with real-time geographically-based information about the make-up of the local energy grid on the other. This produces more accurate estimations of the actual emissions caused by the powering of a company’s cloud infrastructure. When calculated on this level of granularity, Greenly is confident that up to 55% of cloud-based emissions can be cut without any reduction in demand. This, they argue, can be achieved through changing to a more efficient cloud provider; moving data storage somewhere with a better energy mix (e.g. Scandinavia); and planning data transfers/processing to occur at low/off-peak hours. For the HCT case study, however, this was not seen as a priority and so was not included in the engagement.
Case Study 2: DH Benelux Workshop #
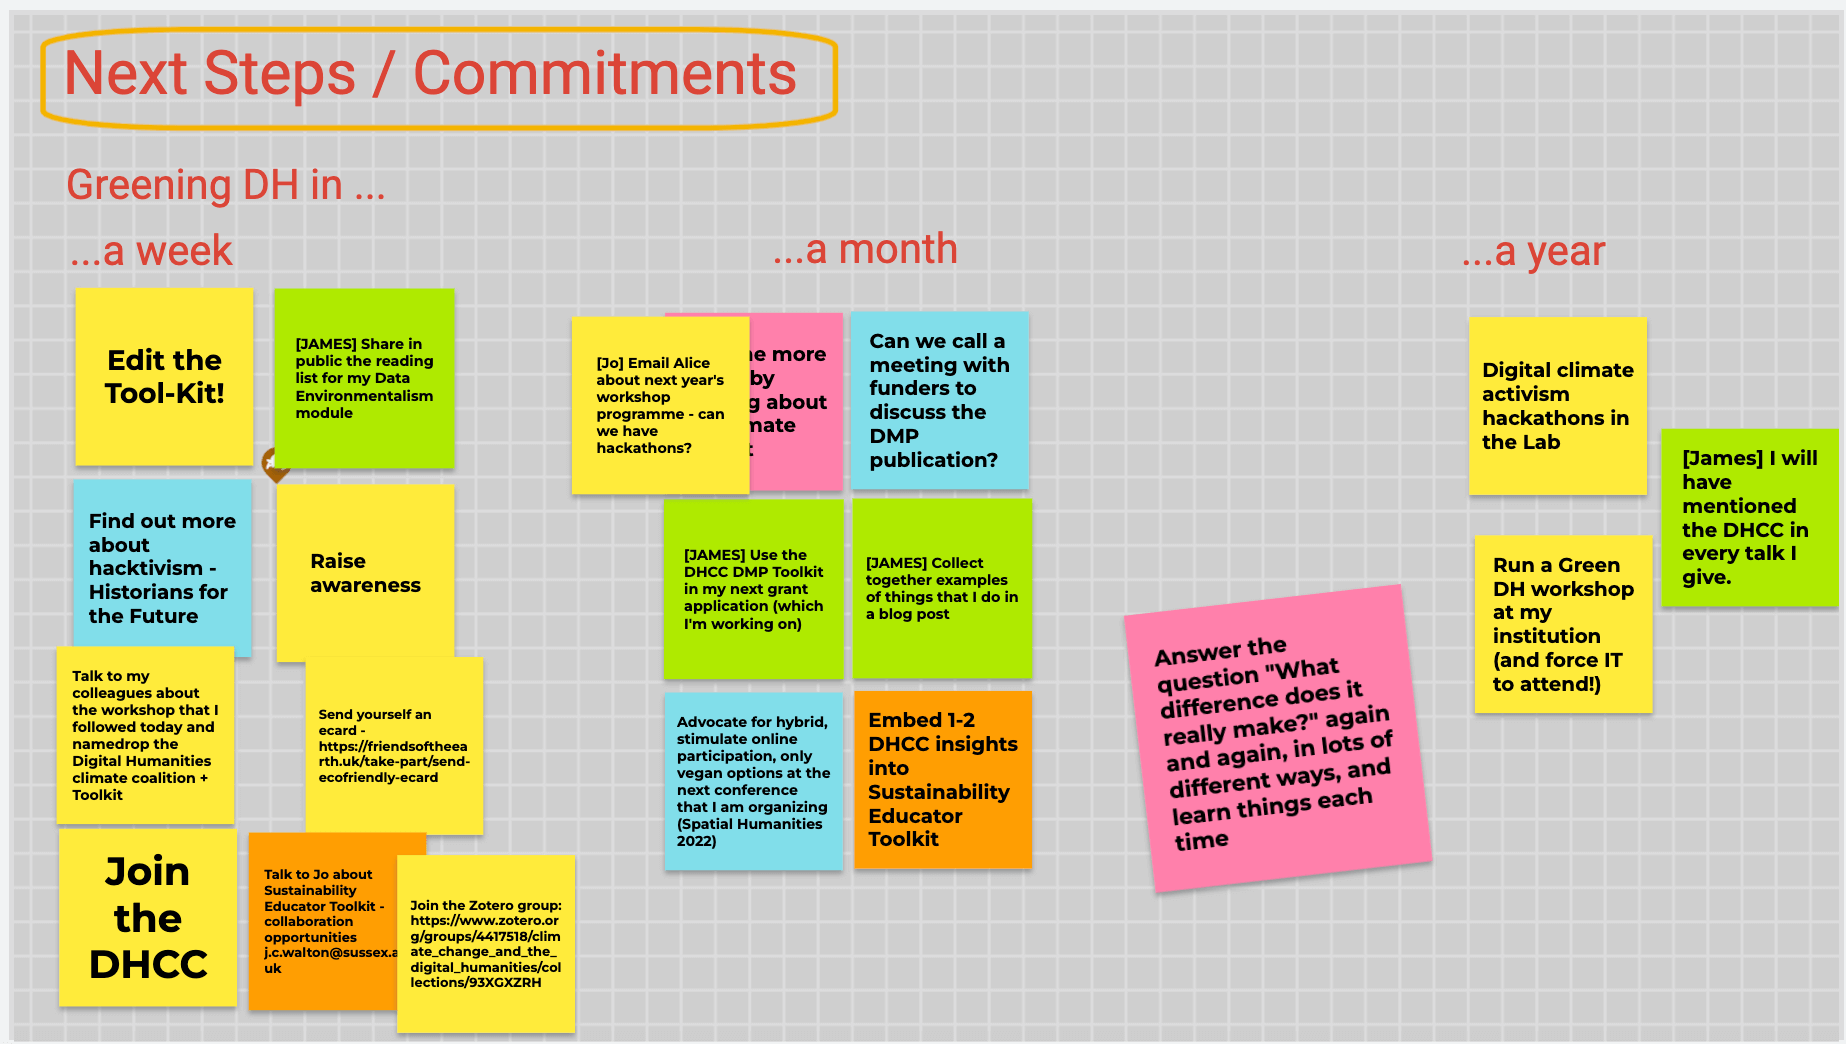
The action-items on the group Jamboard after the workshop finished (31 May 2022)
2.1 Description #
James Baker, Lisa Otty, Christopher Ohge et al. 2022
This was a workshop run in 2022 with DH researchers as the primary audience. We underscored how as arts and humanities researchers it is our role to probe the values, the power structures, and the future imaginaries that underpin sustainable digital solutions. Moreover, given the immense and monopolistic power wielded by the global tech sector, and the critiques of this power that are part of the Digital Humanities, this community is well positioned to create change and demonstrate to our colleagues and collaborators how change can happen. Our use of technology and infrastructure should be informed by the ways corporate economic, cultural, and scientific power perpetuates and exacerbates the crisis. Choosing a hardware or hosting provider, for example, should mean considering direct environmental impacts, broader environmental policies and record of the provider, and more broadly still, the kinds of collective future that such a collaborative encounter presupposes. We should be able to candidly explore the complex and sometimes contradictory nature of our ecological impact: we should be able to measure and model where possible, while also creating context around our measurements, flagging uncertainties, and advocating for transforming wider conditions.
2.2 Themes #
- decarbonising our research and teaching,
- working at the intersection of humanities and digital technology to understand the role of data science in climate transition and climate justice,
- transforming DH (and knowledge institutions) within broader transformations of society.
2.3 Notes #
Access the workshop notes on this Etherpad Document.
2.4 Structure #
Introductions. Refining questions, challenges, opportunities (40 mins)
First, facilitated brainstorming and rapid co-production will refine questions, challenges, and opportunities around climate change and the digital humanities that are relevant in your local contexts. This part of the workshop will draw on the workshop model developed for the November 2021 “Greening DH summit”. This model balances the knowledge that time is fleeting and there is an impetus to act, with an awareness that participants will have variable expertise regarding the climate crisis, the energy/resource costs of digital technologies, and ‘green computing’ practices.
Access the slides.
10 minute break
Greening DH Toolkit (50 minutes)
Second, participants will be asked to respond to sections of the DHCC’s work-in-progress Greening DH Toolkit. Specifically, participants will work in small groups to evaluate prototype sections of the toolkit, and to design their own implementation strategies for these sections. In keeping with the “RE-MIX” theme of the conference, we will discuss how agencies, funding bodies, and institutions in the Benelux region can be leveraged to enable implementation, as well as the barriers they might create.
- Introduction to the Tool-kit and how it is structured [5–10 min]
- Engaging with the tool-kit
- Participants to examine a section of the tool-kit that speaks to their needs and interests [20 min]
- Formulate responses–questions or provocations or suggest edits–and discuss as a group [25 min]
10 minute break
Commitments (up to 60 minutes)
Third, participants will be asked to vocalise their next steps, the commitments they make to their future DH work, so as to create both an individual and collective impetus to act. Participants who would like to continue to collaborate on the Toolkit after the workshop will be invited to join the DHCC Toolkit Action Group.
- How can we translate what we discussed into concrete next steps?
- Possible next steps inspired by an earlier DHCC workshop and maybe H4F workshops [10 min]
- Ask participants what commitments they can make for the next week, month, year, collect those commitments on Jamboard and discuss [20-25 min]
- Pick a commitment and ecard and schedule the card to be sent in a week/month/year as a reminder
Case Study 3: Sussex Digital Humanities Lab Servers #
Nicolas Seymour-Smith, February 2024
3.1 Context #
SHL Digital is a multi-disciplinary digital humanities lab that relies on digital infrastructure to support research and collaboration. In many cases these infrastructure requirements cannot be met by running software on personal computers, e.g. because the computational processing power required is too high, or the hosted service requires a permanent online presence.
To meet these needs so far, the SHL Digital has been relying on its own servers and staff to provide researchers with a platform to run their software. This platform can manage most computational tasks (short of machine-learning applications that require high amounts of GPU power), and can run any custom software that runs on the Linux operating system. In late 2023 and early 2024 we carried out a review, including estimates of carbon impacts.
3.2 Hardware and basic CO2 estimates #
SHL Digital servers are three high-power computers which were bought together in 2018. These were fairly standard commercial servers for the time, and Dell provides their own estimates of the CO2 impact of these servers based on a 4 year life span:
- Two Dell Poweredge R440 servers, 2x7360 kg CO2, 2x1155 kg of which is carbon produced in manufacturing, and the majority of the rest is from estimated computational usage
- One Dell Poweredge R740xd server, 9180 kg CO2, 1321 kg of which is carbon produced in manufacturing, and the majority of the rest is from estimated computational usage
From Dell’s carbon footprint reports: “Dell uses PAIA (Product Attribute to Impact Algorithm) to perform product carbon footprints. PAIA is a streamlined LCA tool developed by MITs Materials System Laboratory. It takes into consideration important attributes of the product which can be correlated to activities in order to calculate the product carbon footprint.”
However none of their documentation explains what level of usage is assumed in making these estimates.
3.3 Improving usage estimates #
Given that it’s possible for us to monitor the CPU usage of our servers, and the number of visitors to our websites, we can make an adjustment to Dell’s estimates, by substituting an impact based on our real usage.
The DHCC Toolkit provides links to resources for calculating carbon impact of computation in a few different contexts. The most relevant for us are:
- Green Algorithms for estimating CO2 impact based on various relevant properties of the server including the ’real usage factor’ of the CPU, and
- CO2.js, which can help us calculate the emissions associated with the number of bytes transmitted from our websites to visitors across internet infrastructure that has its own CO2 impact.
3.4 Monitoring real computational usage #
Plenty of tools and services exist for aggregating CPU usage over long periods. netdata.cloud provides one such free tool that is very simple to install on all platforms and provides a simple web based user interface that can be accessed either locally or through the netdata.cloud website.
Using this tool to monitor the CPU load of our servers for 2 weeks, we got average values of 7.65%, and 1% for our R440 servers, and 1% for our R750xd server. Entering this and other relevant details into http://calculator.green-algorithms.org/, we got 945g and 891g of CO2 per day for our R440s and 450g for our R750xd server.
It’s interesting to note that while our CPU usage is low on both our R440s, it is significantly lower on our second unit, and yet the CO2 calculation is not far different. This implies that at low usage numbers at least, base power usage could be dominating the CO2 output. Further, while the R750xd has similar usage to one of our R440s, the CO2 impact came out roughly half. Given that this unit has half as much memory, perhaps a lot of that base power usage is going into memory use. We could spend some time delving into the details of the calculator to learn more.
All told, the total CO2 impact based on ’real usage’ of processing power is estimated at 2.3 kg/day or 834 kg/year.
3.5 Monitoring real data transmission #
It’s also possible to get the total data transmission values from the netdata.cloud service, but it’s a little more difficult to coax out the value as a total rather than a rate, and so instead I used a separate tool called goaccess. There’s a handy tutorial for setting this up for long term monitoring here.
This provided a monthly data transmission value of 4 GB over a period of a month. A handy tutorial for using CO2.js to calculate CO2 impact from this number can be found here.
This calculation gave us a value of 1.4 kg/month, or 17kg/year. There’s a possibility that adding this value to the 834 kg/year from computational usage involves some double-counting. We’d have to look into the algorithm that co2.js is using to work out the breakdown of CO2 impact in terms of internet infrastructure and computational power to work out how much, if any.
3.6 Our improved estimate #
We can now add the manufacturing impact documented in Dell’s documentation to our ’real’ estimates of computational and transmission impacts to get a potentially improved estimate:
- Manufacturing: 3632 kg
- Real CPU: 834 kg/year
- Real data transmission: 17 kg/year
Taking the same lifespan assumption as the Dell documentation (4 years): that gives us an overall impact of 7036 kg, which is a third of Dell’s 23900 kg estimate based on an unknown usage factor.
Given our very low usage statistics and the disparity with the Dell estimate, we might assume that the majority of our CO2 impact comes from basic power requirements of the idle system.
3.7 Conclusion #
This work was undertaken as part of a broader analysis of SHL Digital’s resources and needs, in order to plan for efficient provision of these services in the future. This analysis allowed us to weigh sustainability as a factor into those plans. From this perspective, we can ask the following questions:
- Could downsizing our server infrastructure to more closely match our real-terms usage and traffic reduce our carbon impact (by reducing manufacturing related CO2 and basic power requirements) without running us into issues of procesing power? At first glance this seems likely.
- Whether downsizing could also be accompanied by migration to externally hosted and or shared services could be an interesting follow on.
Case Study 4: Congruence Engine - raising environmental awareness in an interdisciplinary research project #
Natasha Kitcher, Max Long, and Anna-Maria Sichani, January 2025
Overview #
Congruence Engine was a digital humanities project which ran between late 2021 and early 2025. Combining the expertise of museum curators, academic historians, and data scientists, the project explored new ways of linking industrial heritage, focussing on three key strands at the heart of UK industrial history: energy, communications, and textiles. Congruence Engine was based at the Science Museum in London, and involved the collaboration of more than two dozen partner organisations from across the UK.
We were one of five projects funded by the UK’s Arts and Humanities Research Council (AHRC), as part of its Towards a National Collection (TaNC) funding stream. The TaNC programme explored opportunities for the development of a ‘UK digital collection’ by forging links between heritage items and expanding access to the nation’s collections.
Although UK Research and Innovation (UKRI) and the AHRC have made substantial infrastructure investments to achieve carbon-neutral computing by 2040, the TaNC programme did not develop a shared environmental impact strategy across the projects that it funded. It was not until the final year of the project that we were able to take the time to reflect on our own environmental impact as a project and what that might mean for future recommendations for the development of collections-linking digital infrastructure. We also wanted to explore how the Science Museum Group’s own approach to environmental ethics, including their decision to accept corporate sponsorship from major energy corporations such as Adani, might affect our own positionality as individual researchers and as a collective (see the SMG sustainability approach, and blogs (1) and (2) on the topic).
Our approach #
The decentralised and experimental nature of the project, with over 40 investigations taking place simultaneously made it difficult to establish a united approach to environmental ethics. This was also complicated by the interdisciplinary composition of the team, which included museum curators, academic researchers, data and computer scientists, and administrative and managerial staff. The team included individuals employed directly by the Science Museum, as well as collaborators spread across partner institutions. Each team member arrived with a different set of personal priorities and expectations, and technical expertise, as well as being bound by a range of institutional working practices and policies.
Over the course of the project there were sporadic and ongoing discussions about the environmental and social impacts of digital research, and particularly of computationally intensive tasks involving machine learning (ML) and Large Language Models (LLMs). In the last year of the project we established an environmental impact working group, led by Natasha Kitcher, Max Long, Anna-Maria Sichani, and Kunika Kono.
This work was kick-started by Kunika Kono’s decision to investigate her own electricity usage during the project. Kunika used a single board computer to run typical tasks involved in her Congruence Engine work, and recorded the electricity required to perform these tasks using a USB-ammeter (a device for measuring the electrical current in a circuit). The group considered if it would be possible to scale this up for the project as a whole, asking each team member to calculate their usage for a day. The aim of this approach would have been to provide tangible insights into the energy demands of the project’s daily computational activities and to promote greater awareness of the environmental impact associated with their work. But, after investigating a range of hardware and software options, we decided that it would not be feasible to undertake this kind of assessment. We realised that measuring local consumption by a representative sample of the team using an ammeter presented technical challenges, particularly in isolating the consumption associated with individual tasks. Moreover, we were conscious of the fact that some of our largest environmental costs were likely associated with cloud services and other external providers. While numerous tools are available to measure these impacts, their value is principally in awareness-raising, and we found they would not enable us to accurately understand our use of LLMs.
Instead, we focussed our energies on building a collective awareness of the environmental impact of digital research across the project team. Our approach comprised a set of targeted actions:
We established a Zotero group library on the environmental impacts of computationally intensive research. This has been mainly used as an initial starting point for our own research and work and gradually developed to a dynamic reference point for the entire project team. The library currently contains 71 resources and is now open to the wider cultural heritage community as a work-in-progress - please feel free to join and add your resources too!
We ran a qualitative survey to assess our team’s working practices from an environmental point of view, including research and administrative staff.
Two members of the team participated in a two-day Carbon Literacy training organized by the Heritage Trust Network for cultural heritage professionals and researchers.
We held a workshop for members of the project around environmental ethics in research. This workshop was a great opportunity for us to collectively reflect on the environmental impacts of our research practices, and to share and discuss the results of the survey. Learnings from our Carbon Literacy training course were also shared with the wider team.
Outcomes on github #
A full write-up of the impact of our work, including results from our internal survey and details about the workshop, is available to view on the DHCC github.